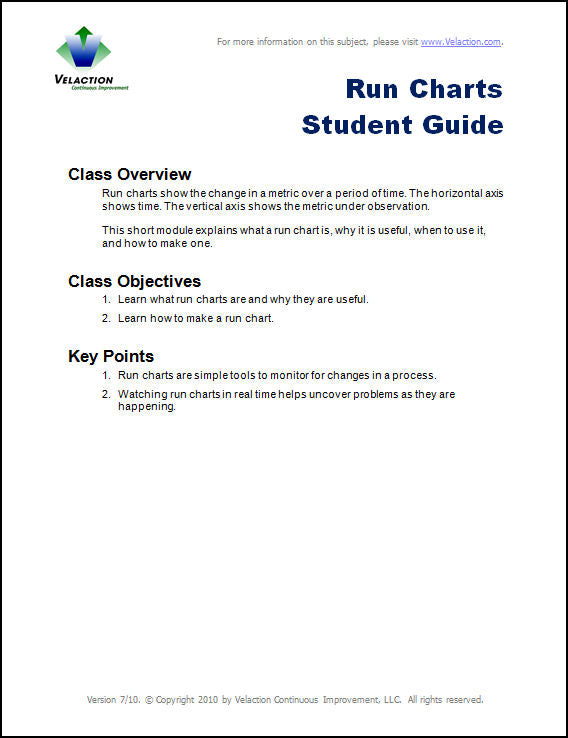
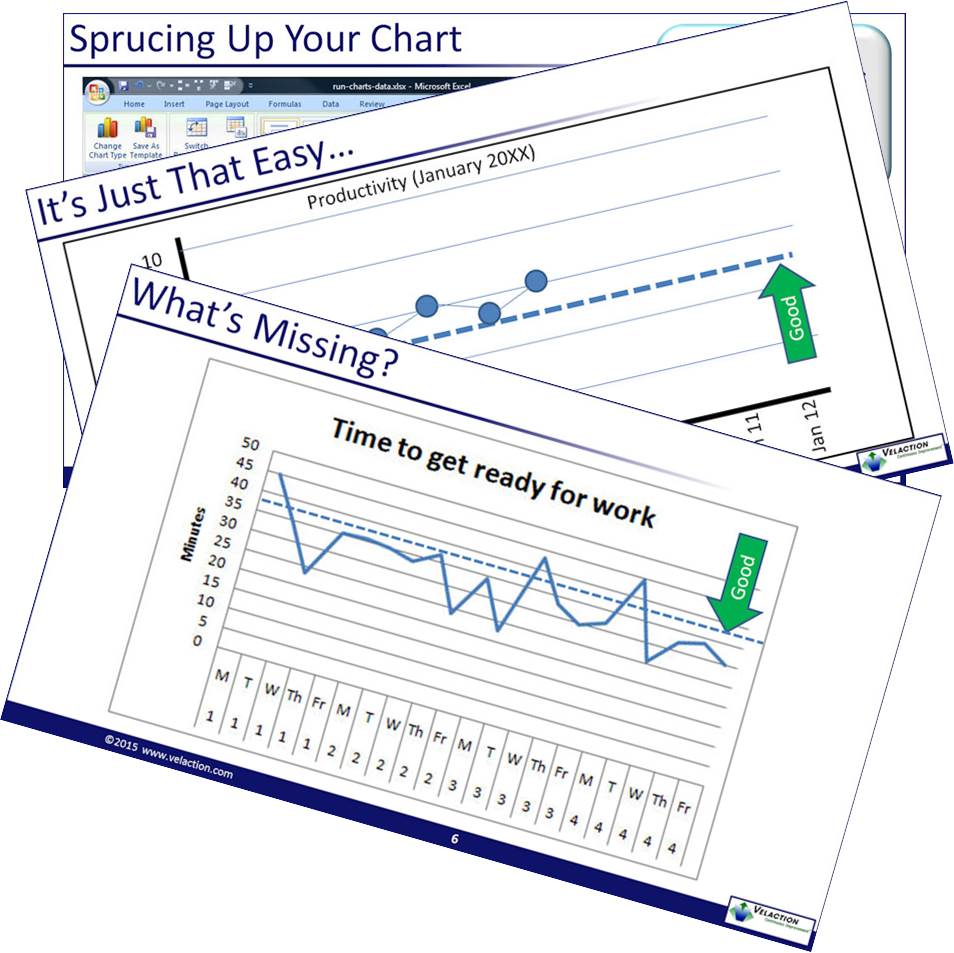


Run charts are a great way to track changes in a process or metrics over time. The horizontal axis shows time. The vertical axis shows the metric under observation.
They are extremely useful because run charts are simple to set up, and are easily understandable by most people.
This short module explains what a run chart is, why it is useful, when to use it, and how to make one. It shows how to make a run chart manually, as well as in Microsoft Excel.
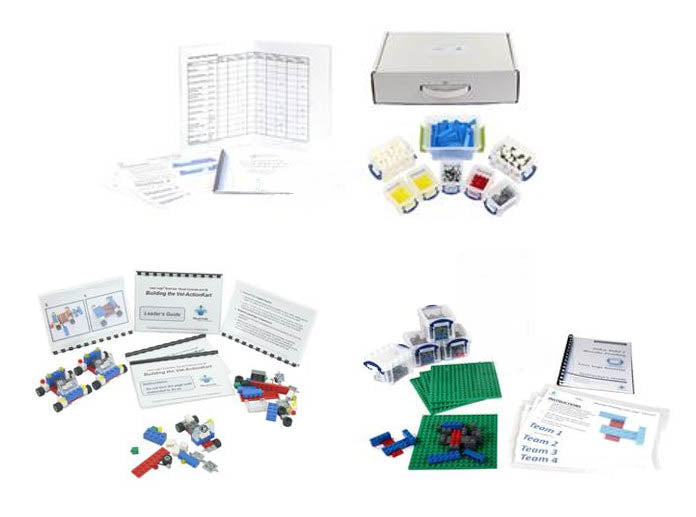
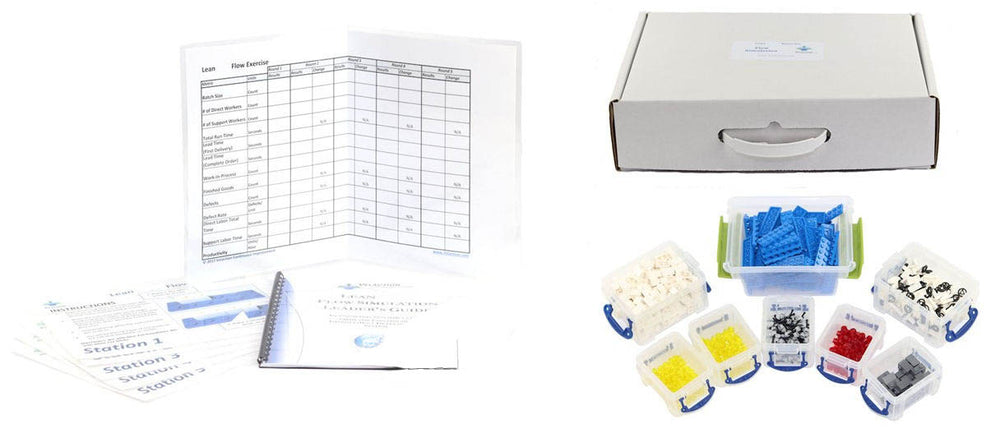
This Trainer Download Pack provides the tools needed to train your own team on this important topic.
You will receive an email with a link to download your digital product(s). This link will expire after 3 downloads.
This product comes with a corporate license which allows you to share the product within your company only.
The license is automatically assigned to the company name used in the purchase of the product, or if no company included in the purchase, to the company email used in the transaction. If a personal email is used, the license must be manually assigned.
The license is permanent and non-transferable. It is valid only for single reporting units of companies under 20,000 people. For example, that means that a holding company would need licenses for each company in its portfolio.