Cause and Effect / Ishikawa Diagram / Fishbone Diagram PowerPoint Presentation

SKU: CEPPT
Cause and Effect / Ishikawa Diagram / Fishbone Diagram PowerPoint Presentation

Cause and Effect / Ishikawa Diagram / Fishbone Diagram PowerPoint Presentation

SKU: CEPPT
Regular price $9.99
/
  • Secure payments
  • Digital Product (See Delivery Info Below)
  • Corporate License (See Licensing Info Below)
Shipping calculated at checkout.

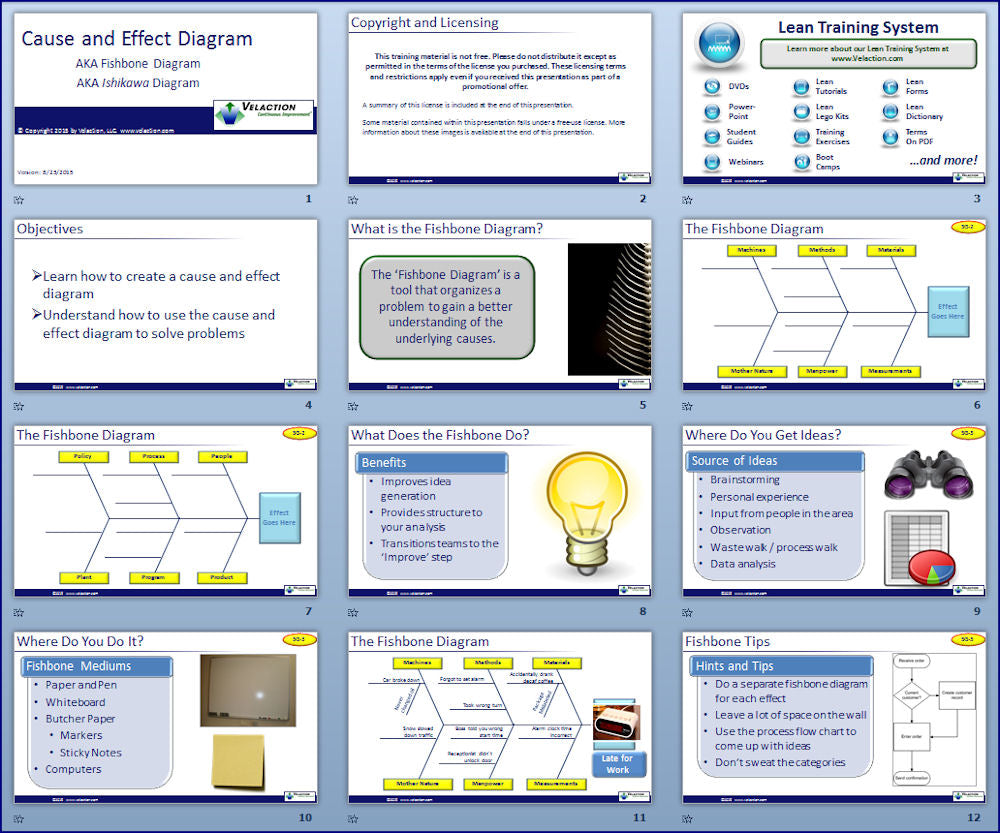
The cause and effect diagram (also known as the Ishikawa diagram or the fishbone diagram) provides teams with a way to categorize causes of problems (the effect).

This module explains how to create a cause and effect diagram, when to use it, and how to interpret it.

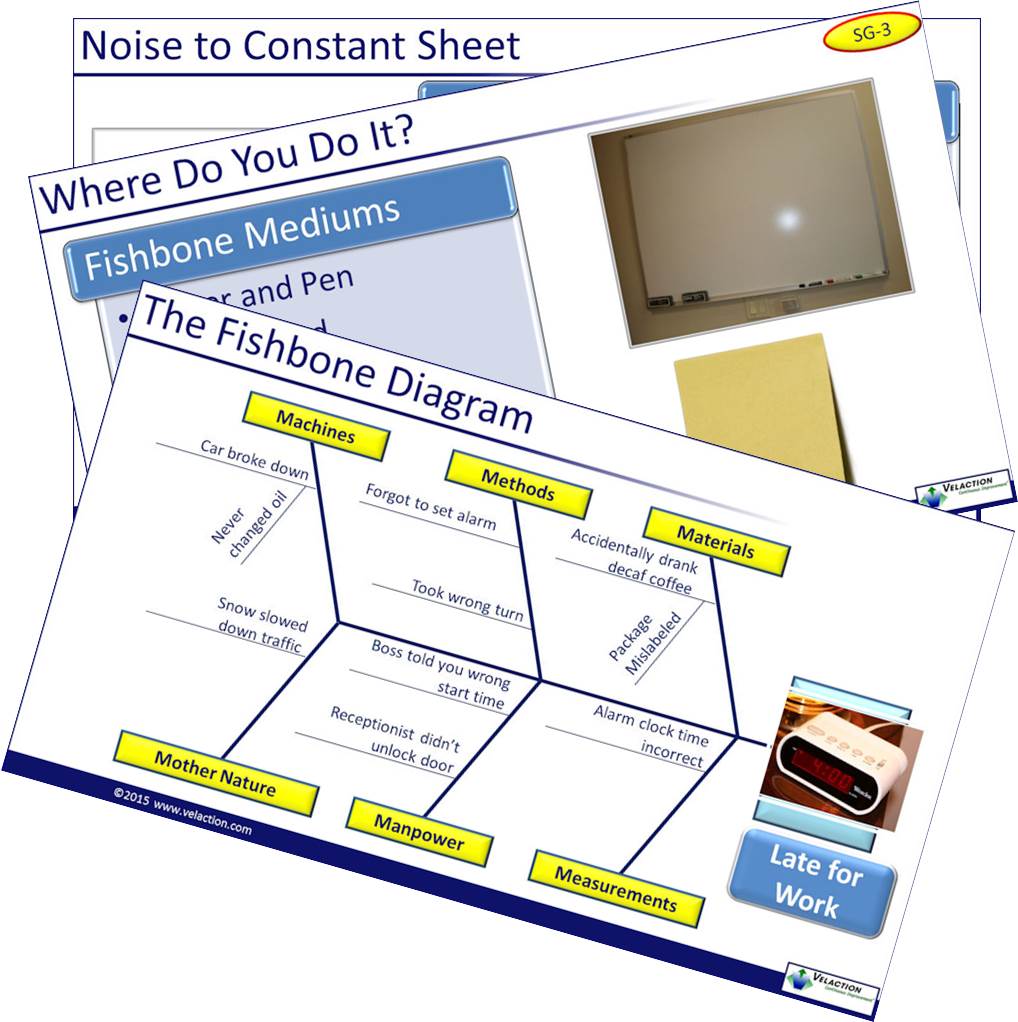
Because a cause and effect diagram, with its classic fishbone shape, is so visual, it is an outstanding communication tool. There is also a tremendous value in using a structured, systematic, compartmentalized thinking process to evaluate the causes of a particular effect.

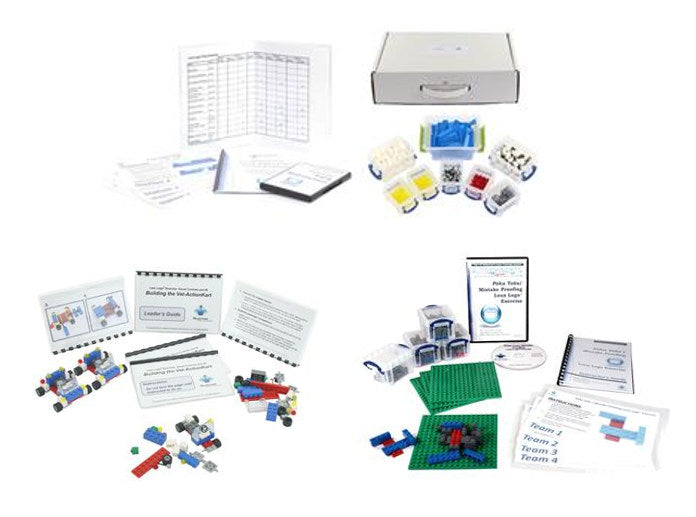
This PowerPoint presentation on the Ishikawa Diagram provides trainers a tool to teach the cause and effect diagram in a highly visual, engaging way. When combined with the additional components of this module (student guides, exercise, etc.) the full power of Velaction's Lean training system is unleashed. And, of course, the consistent look and feel of our PowerPoint packages lets you seamlessly build out your training capabilities as your need demand it.

  • License Type: Corporate
  • Number of Slides: 10
  • Target Time: 30 minutes + 30 minutes for optional exercise
  • Format: PowerPoint (PPTX)
  • Delivery: Immediate download

This Cause & Effect Diagram / Fishbone Diagram PowerPoint presentation covers the following topics:

1. What is the cause and effect diagram

a. Why does it have so many names?

b. Principle of cause and effect

2. Steps to creating a cause and effect diagram

a. Choose the format (computer, ?butcher paper? roll, etc.)

b. Create the layout

c. Label the categories

d. Add the causes

i. Cascading causes

3. Purpose of the cause and effect diagram

a. Idea generation / brainstorming backdrop

b. Provides structure to analysis

c. Transitions team to improvement phase

4. Where do ideas come from?

5. Sample Fishbone Diagram

a. Note: This slide links to the optional exercise

6. Tips

7. Options

a. Noises and constants

b. Observed causes or potential causes

c. Alternative categories

You will receive an email with a link to download your digital product. This link will expire after 3 downloads.

This product comes with a corporate license which allows you to share the product within your company only.

The license is automatically assigned to the company name used in the purchase of the product, or if no company included in the purchase, to the company email used in the transaction. If a personal email is used, the license must be manually assigned.

The license is permanent and non-transferable. It is valid only for single reporting units of companies under 20,000 people. For example, that means that a holding company would need licenses for each company in its portfolio.

This site is protected by reCAPTCHA and the Google Privacy Policy and Terms of Service apply.

Recently viewed